Scalability
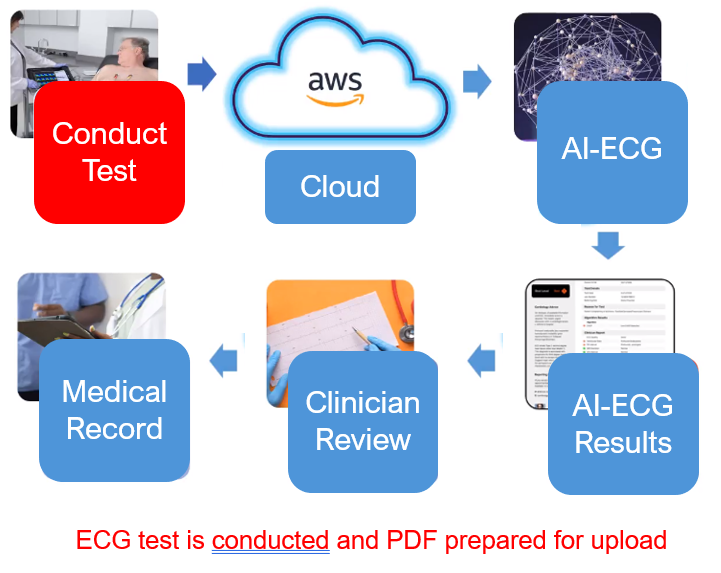
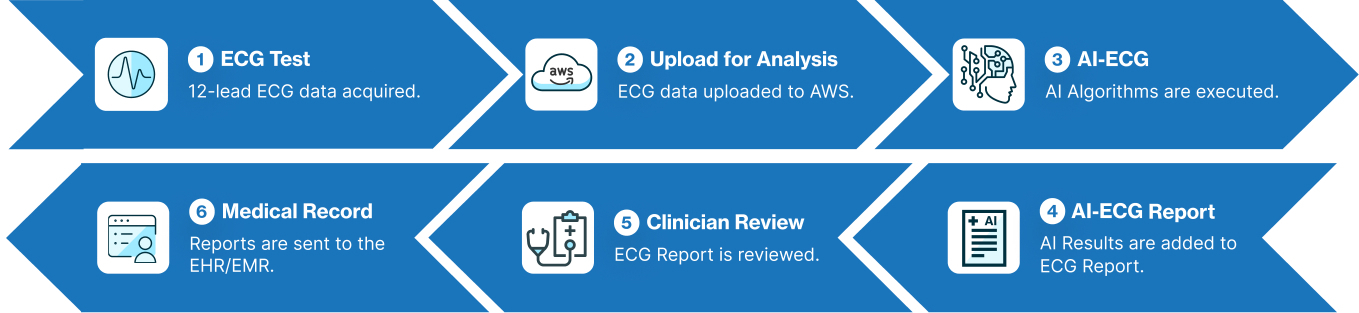
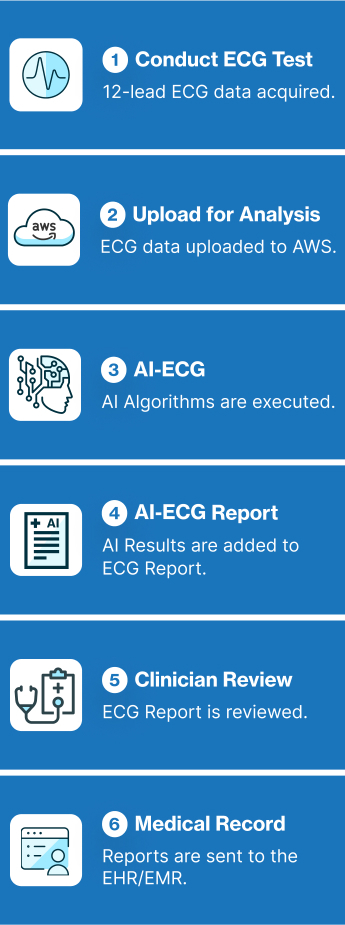
A cloud platform can handle large volumes of ECG data and seamlessly scale to accommodate.
Accessibility
Access ECG results from anywhere with an internet connection allowing for timely review, and collaboration.
Efficiency
Cloud technology can process ECG data rapidly, providing near-instant results and streamlining the diagnostic process.
Collaboration
Cloud-based solution facilitates collaboration leading to more confident treatment decisions.
Cost-Effectiveness
Avoid significant upfront infrastructure costs and pay only for the resources they use.
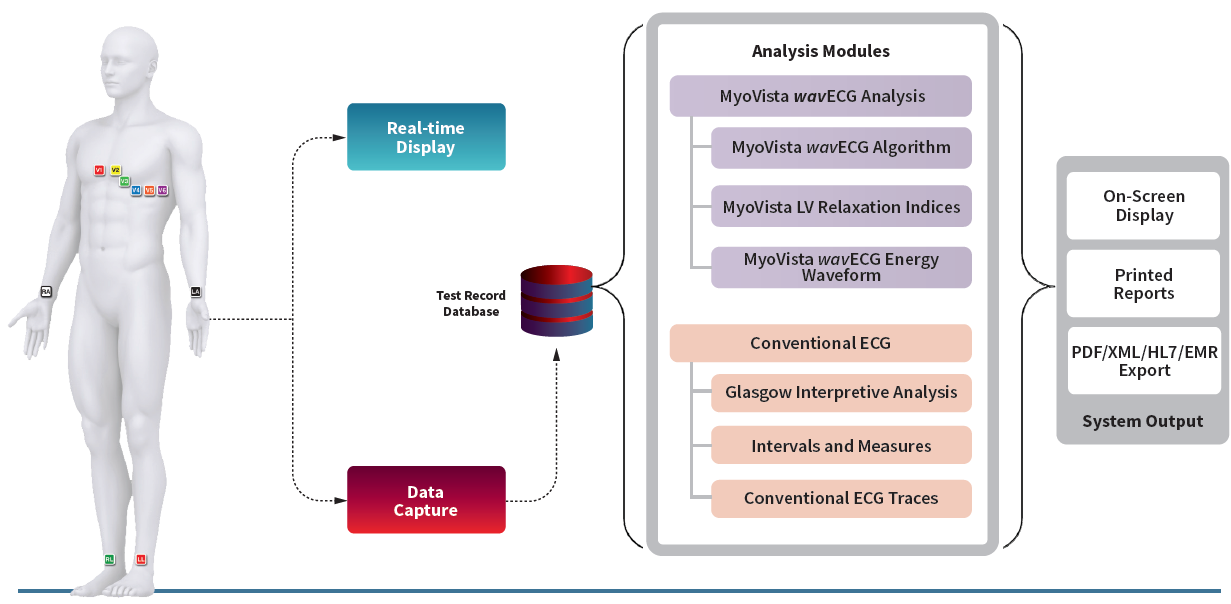
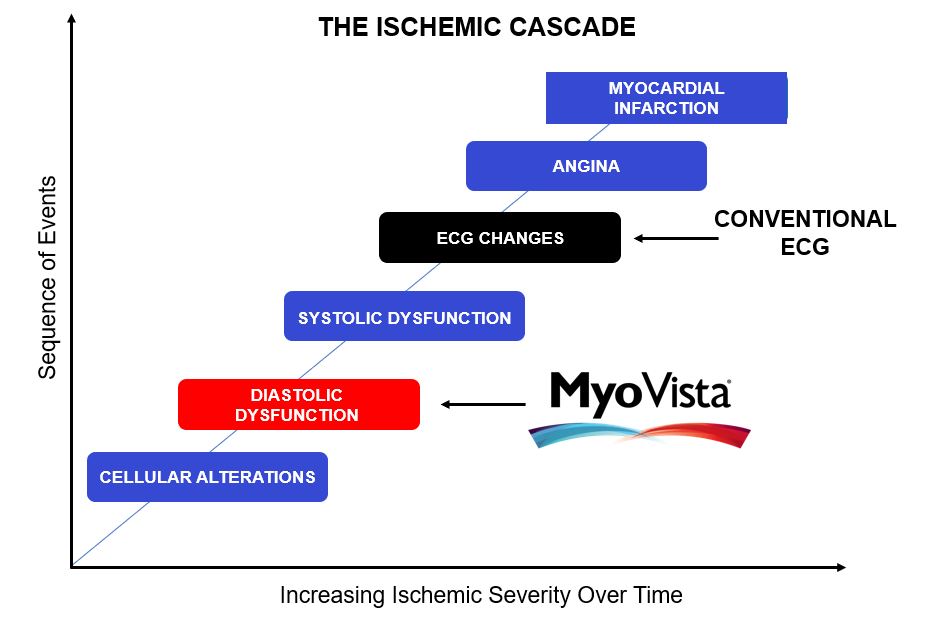
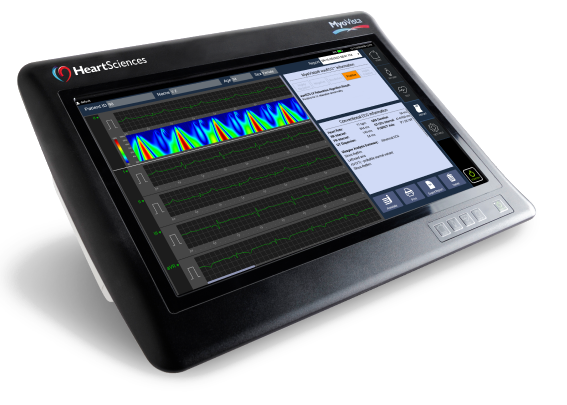
The MyoVista® wavECG™ is a 12-lead resting ECG device designed to provide diagnostic information related to cardiac dysfunction during the diastolic phase* of the cardiac cycle. This diagnostic information has traditionally only been available through the use of cardiac imaging. Now, MyoVista wavECG Technology provides an innovative, in-office advancement for electrocardiographic testing designed to provide physicians with new information to improve patient risk-assessment related to cardiac dysfunction. The MyoVista® Device provides all the information and capabilities of a full-featured conventional resting 12-lead ECG within the same test and follows the same clinical AHA/IEC lead placement protocol.
HeartSciences’ Impaired Relaxation AI-ECG Algorithm is a specialized tool designed to analyze electrocardiograms (ECGs) and identify abnormalities by automating the assessment of diastolic function. Extensive research confirms that almost all forms and co-morbidities of heart disease are associated with left ventricular diastolic dysfunction (LVDD) including hypertension, diabetes, valvular disease, ischemia, and reduced systolic function. The MyoVista wavECG AI-based Algorithm is designed to detect LV diastolic abnormalities caused by heart disease and/or age-related cardiac dysfunction.
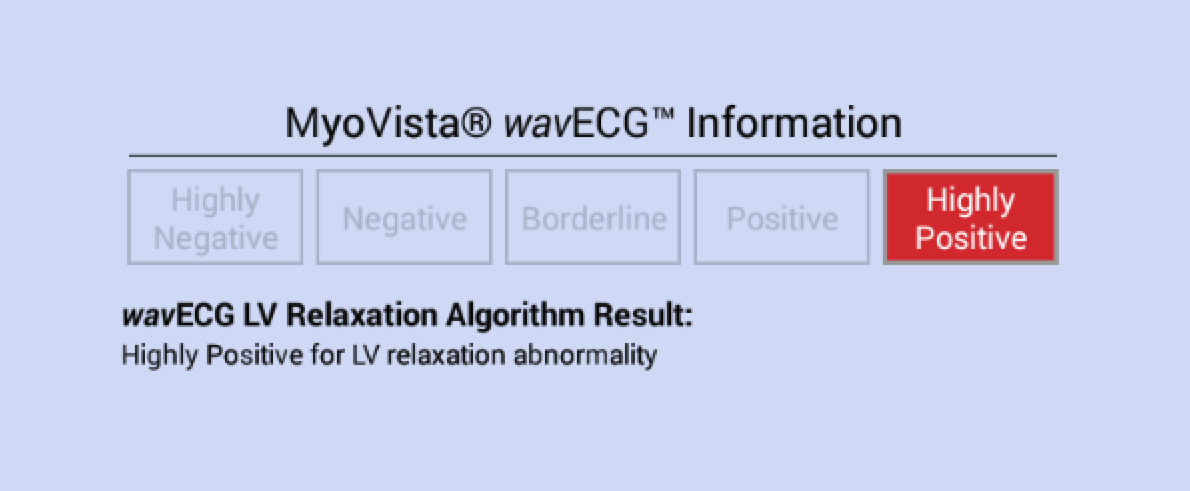
MyoVista wavECG LV Relaxation Algorithm Result Statements
The MyoVista wavECG LV Relaxation Algorithm is calculated using AI-based algorithms which incorporate data from the transformed ECG signal using continuous wavelet signal processing as well as conventional ECG information. The wavECG LV Relaxation Algorithm Result is provided in both indicator and statement form and displays the result as either “Highly Negative”, “Negative”, “Borderline”, “Positive” or “Highly Positive” for LV relaxation abnormality.
MyoVista® Wavelet ECG (wavECG™):
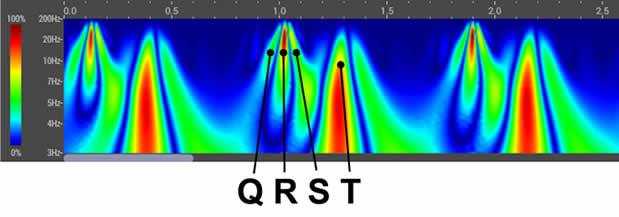
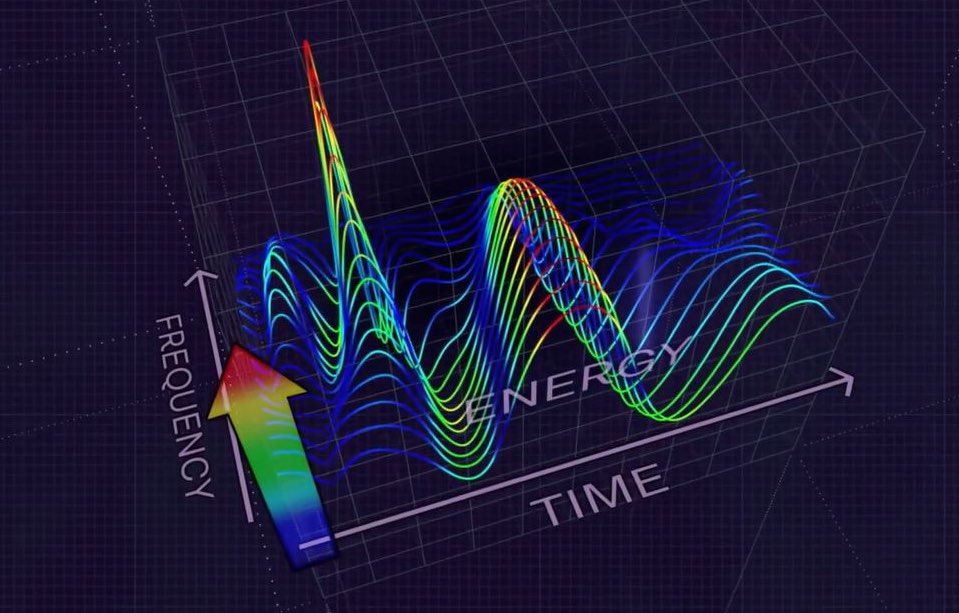
The MyoVista® wavECG, utilizes an advanced form of signal processing called Continuous Wavelet Transform (CWT).
- CWT extracts valuable frequency information from acquired ECG signals
- The resulting data is then analyzed using artificial intelligence (AI) algorithms.Clinical Impact:
- Undetected heart disease remains a significant challenge in healthcare.
- Millions of ECGs are performed weekly, and HeartSciences aims to revolutionize their clinical utility.
- By combining research, wavelet signal processing, and AI, HeartSciences strives for the early detection of heart disease.
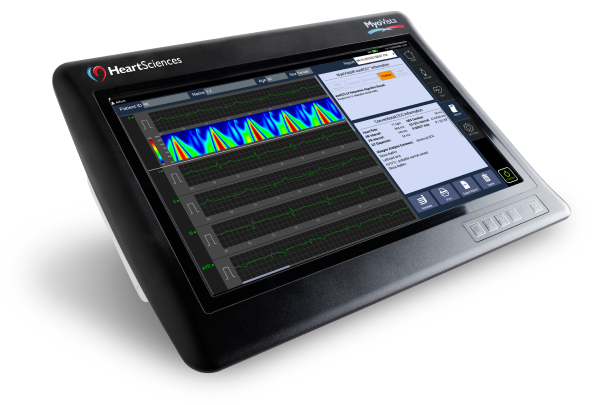
The MyoVista® wavECG™ is a 12-lead resting ECG device designed to provide diagnostic information related to cardiac dysfunction during the diastolic phase* of the cardiac cycle. This diagnostic information has traditionally only been available through the use of cardiac imaging. Now, MyoVista wavECG Technology provides an innovative, in-office advancement for electrocardiographic testing designed to provide physicians with new information to improve patient risk-assessment related to cardiac dysfunction. The MyoVista® Device provides all the information and capabilities of a full-featured conventional resting 12-lead ECG within the same test and follows the same clinical AHA/IEC lead placement protocol.
HeartSciences’ Impaired Relaxation AI-ECG Algorithm is a specialized tool designed to analyze electrocardiograms (ECGs) and identify abnormalities by automating the assessment of diastolic function. Extensive research confirms that almost all forms and co-morbidities of heart disease are associated with left ventricular diastolic dysfunction (LVDD) including hypertension, diabetes, valvular disease, ischemia, and reduced systolic function. The MyoVista wavECG AI-based Algorithm is designed to detect LV diastolic abnormalities caused by heart disease and/or age-related cardiac dysfunction.
MyoVista wavECG LV Relaxation Algorithm Result Statements
The MyoVista wavECG LV Relaxation Algorithm is calculated using AI-based algorithms which incorporate data from the transformed ECG signal using continuous wavelet signal processing as well as conventional ECG information. The wavECG LV Relaxation Algorithm Result is provided in both indicator and statement form and displays the result as either “Highly Negative”, “Negative”, “Borderline”, “Positive” or “Highly Positive” for LV relaxation abnormality.
MyoVista® Wavelet ECG (wavECG™):
The MyoVista® wavECG, utilizes an advanced form of signal processing called Continuous Wavelet Transform (CWT).
- CWT extracts valuable frequency information from acquired ECG signals
- The resulting data is then analyzed using artificial intelligence (AI) algorithms.Clinical Impact:
- Undetected heart disease remains a significant challenge in healthcare.
- Millions of ECGs are performed weekly, and HeartSciences aims to revolutionize their clinical utility.
- By combining research, wavelet signal processing, and AI, HeartSciences strives for the early detection of heart disease.
- Provides information related to patient risk for LV relaxation abnormality associated with LVDD
- Displays test result as Highly Negative, Negative, Borderline, Positive or Highly Positive
- Non-invasive
- Follows existing workflow /clinical pathway
- Follows AHA/IEC lead placement protocols
- Includes conventional 12-lead ECG information and University of Glasgow Interpretive Analysis Report within the same test
- PDF and XML file exportable (HL7 capable)
- Quick: 20/30/60 second test and results
- EMR-EHR capable
- Wi-Fi printer enabled